
Every number your store makes,
measured first-party.
Two reports, built into the dashboard. Sales tells you what people bought. Traffic tells you how they got there and where they dropped off. No tag manager, no pixel, no third party in between.
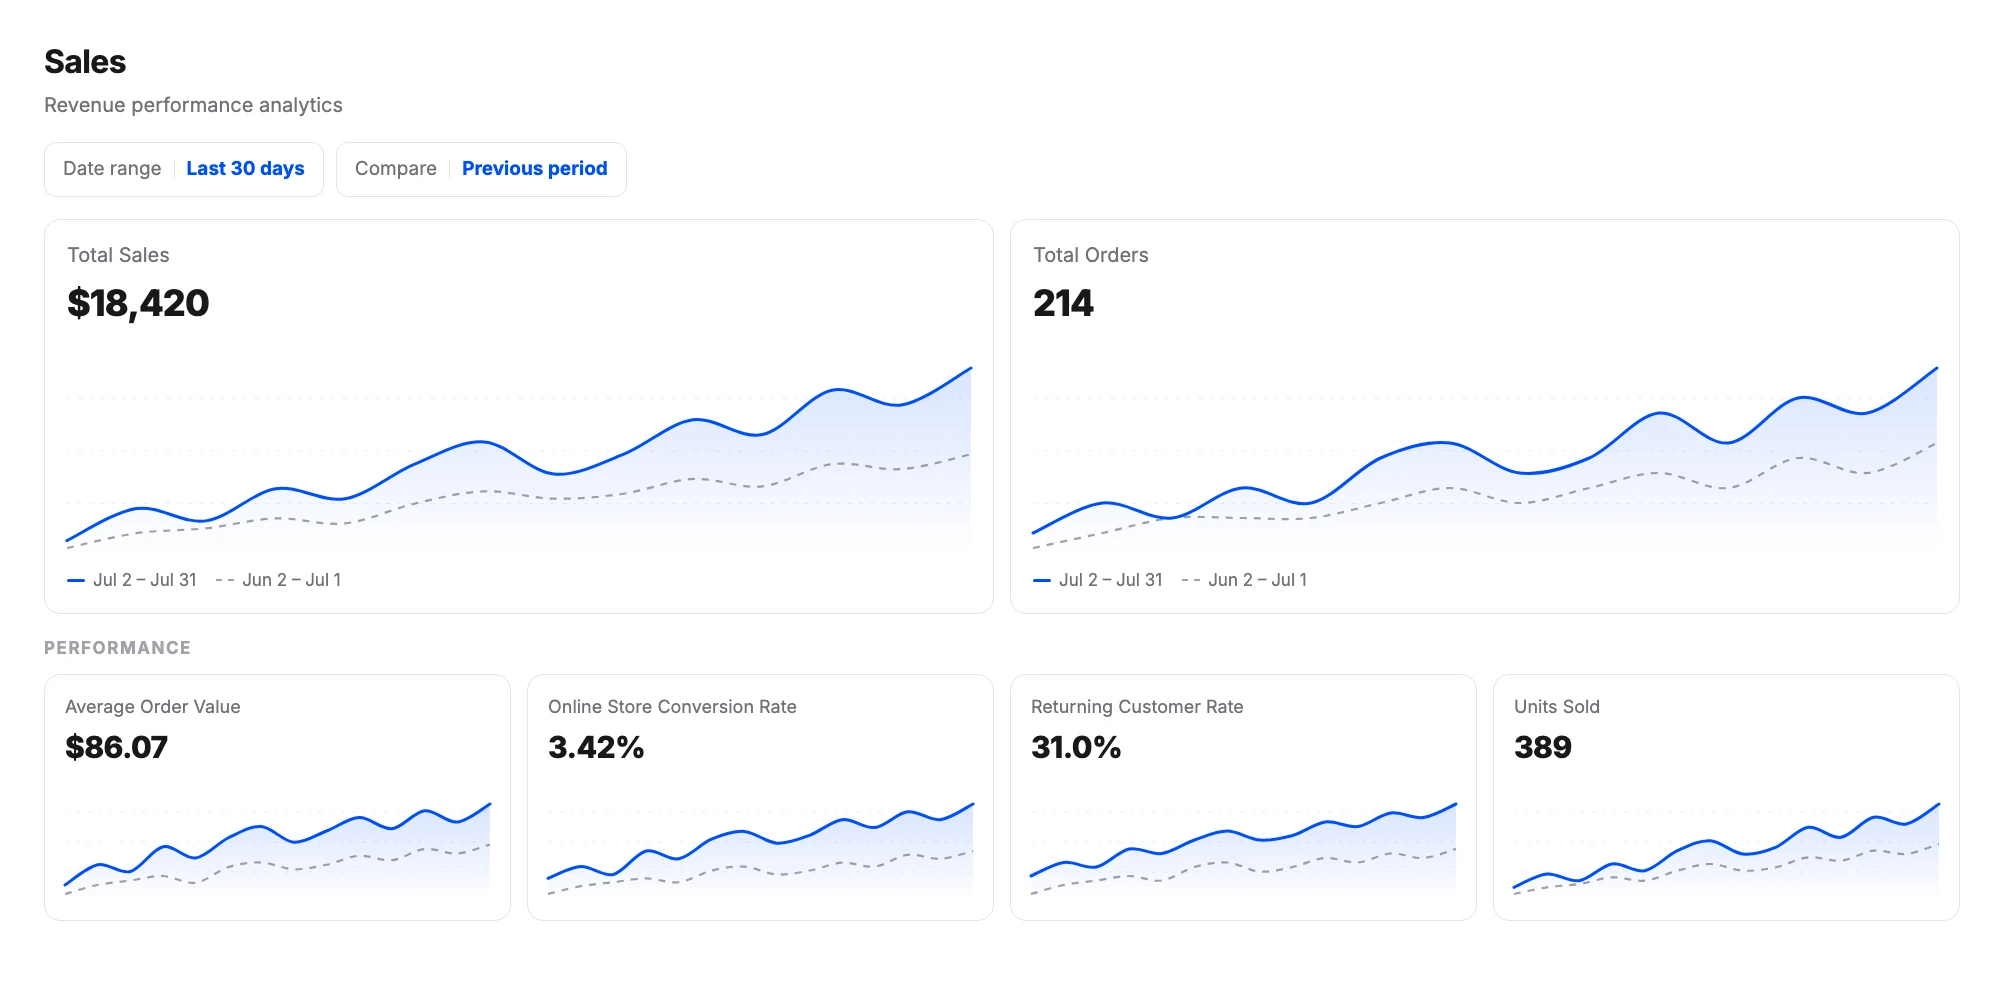
The Sales report, over the window you pick, against the one before it.
One says what sold.
The other says why.
Tab one
Sales
Revenue Performance Analytics. Read-only reporting that turns activity into totals, best sellers, locations, payment methods, and the revenue you lost.
Tab two
Traffic
Website Traffic Metrics. How visitors find the store, how they move through it, and where they leave before buying.
Where they came from,
and which channel actually paid.
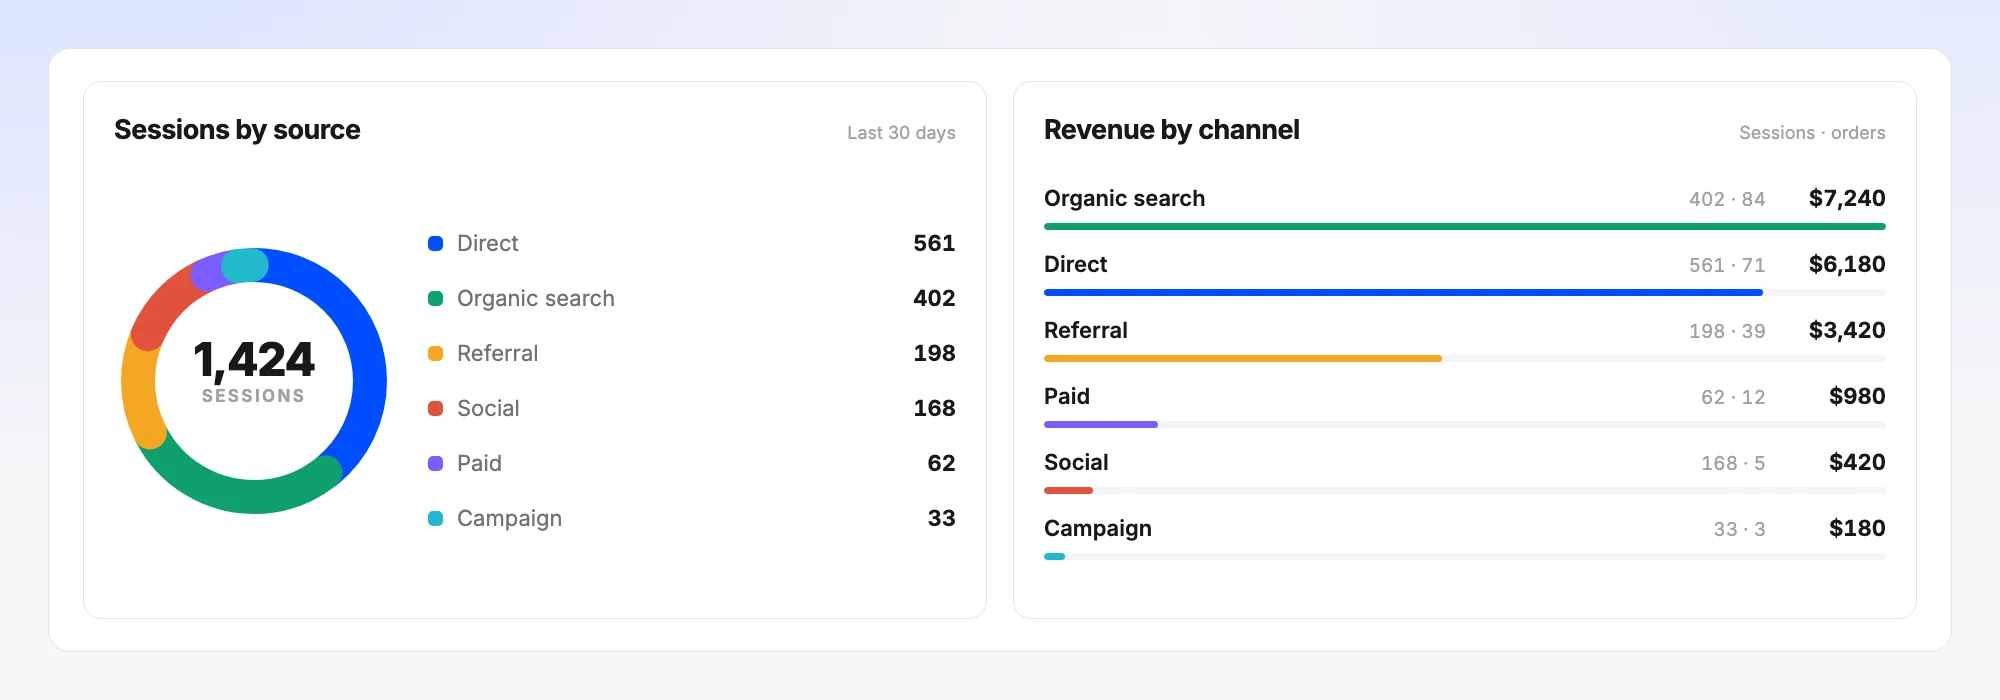
A channel can send plenty of sessions and earn nothing, which is exactly what you want to catch. And visits you make from your own dashboard are counted as Direct, never as Referral, so checking your own store never pollutes the numbers.
How many arrived,
and how they behaved.
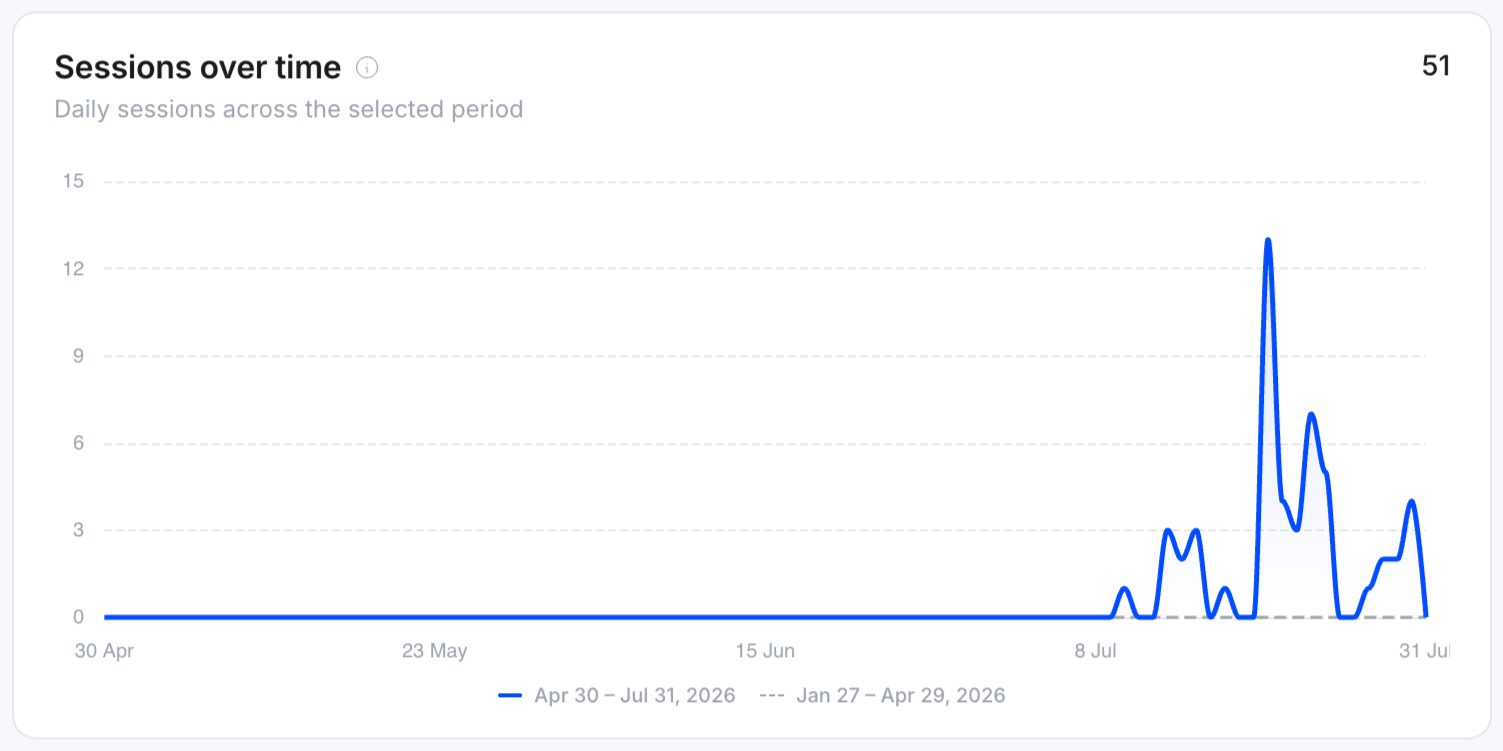
Seven headline numbers, then the shape of the traffic over the period. A realtime pill next to the date controls shows who is on the store right now.
- Site sessions
- Total visits to the store in the period.
- Unique visitors
- The distinct people behind those sessions.
- Avg session duration
- Time spent per visit. It sits at zero until people view more than one page, so a landing-page-only visit contributes nothing.
- Pages / session
- How far into the store a visit goes.
- Bounce rate
- The share of sessions that left after a single page.
- Conversions
- Sessions that ended in an order.
- Conversion rate
- Conversions divided by sessions.
Five steps.
Read the gaps.
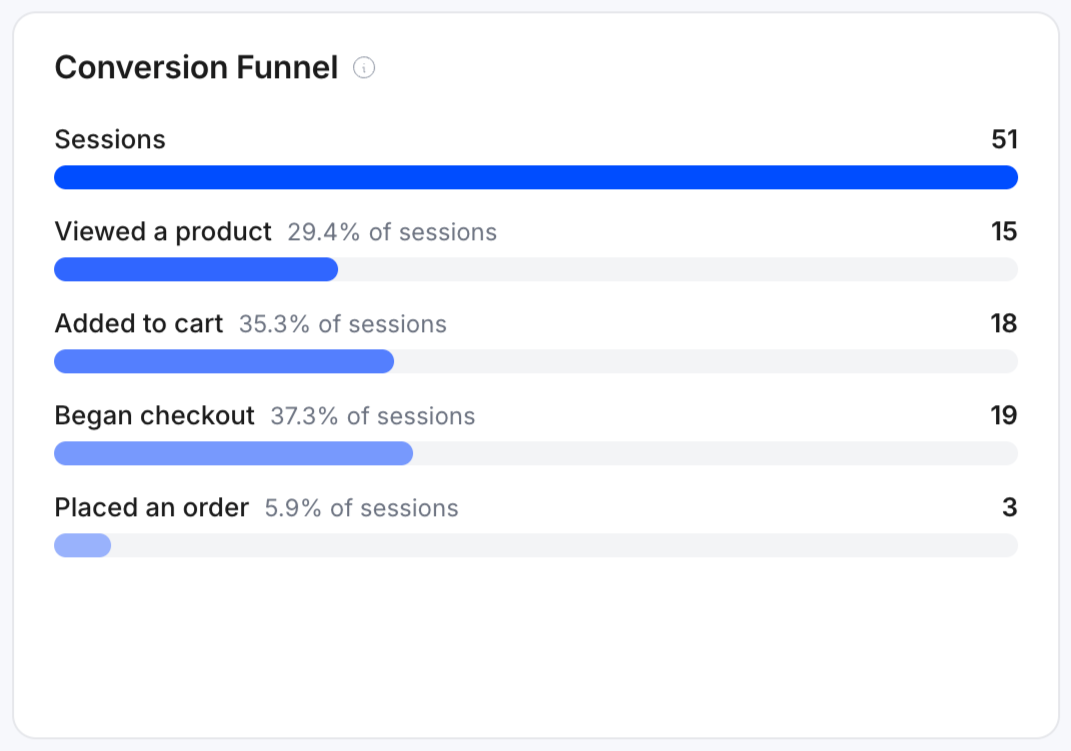
Arrival to order, stage by stage, each with its count and its share of sessions. Every stage should be smaller than the one above it, so the biggest drop is the thing to go fix.
- Sessions
- Viewed a product
- Added to cart
- Began checkout
- Placed an order
Revenue and orders,
against the period before.
Both headline cards plot the current period as a solid line and the comparison period as a dashed one, so a good week is obvious without reading a single number.
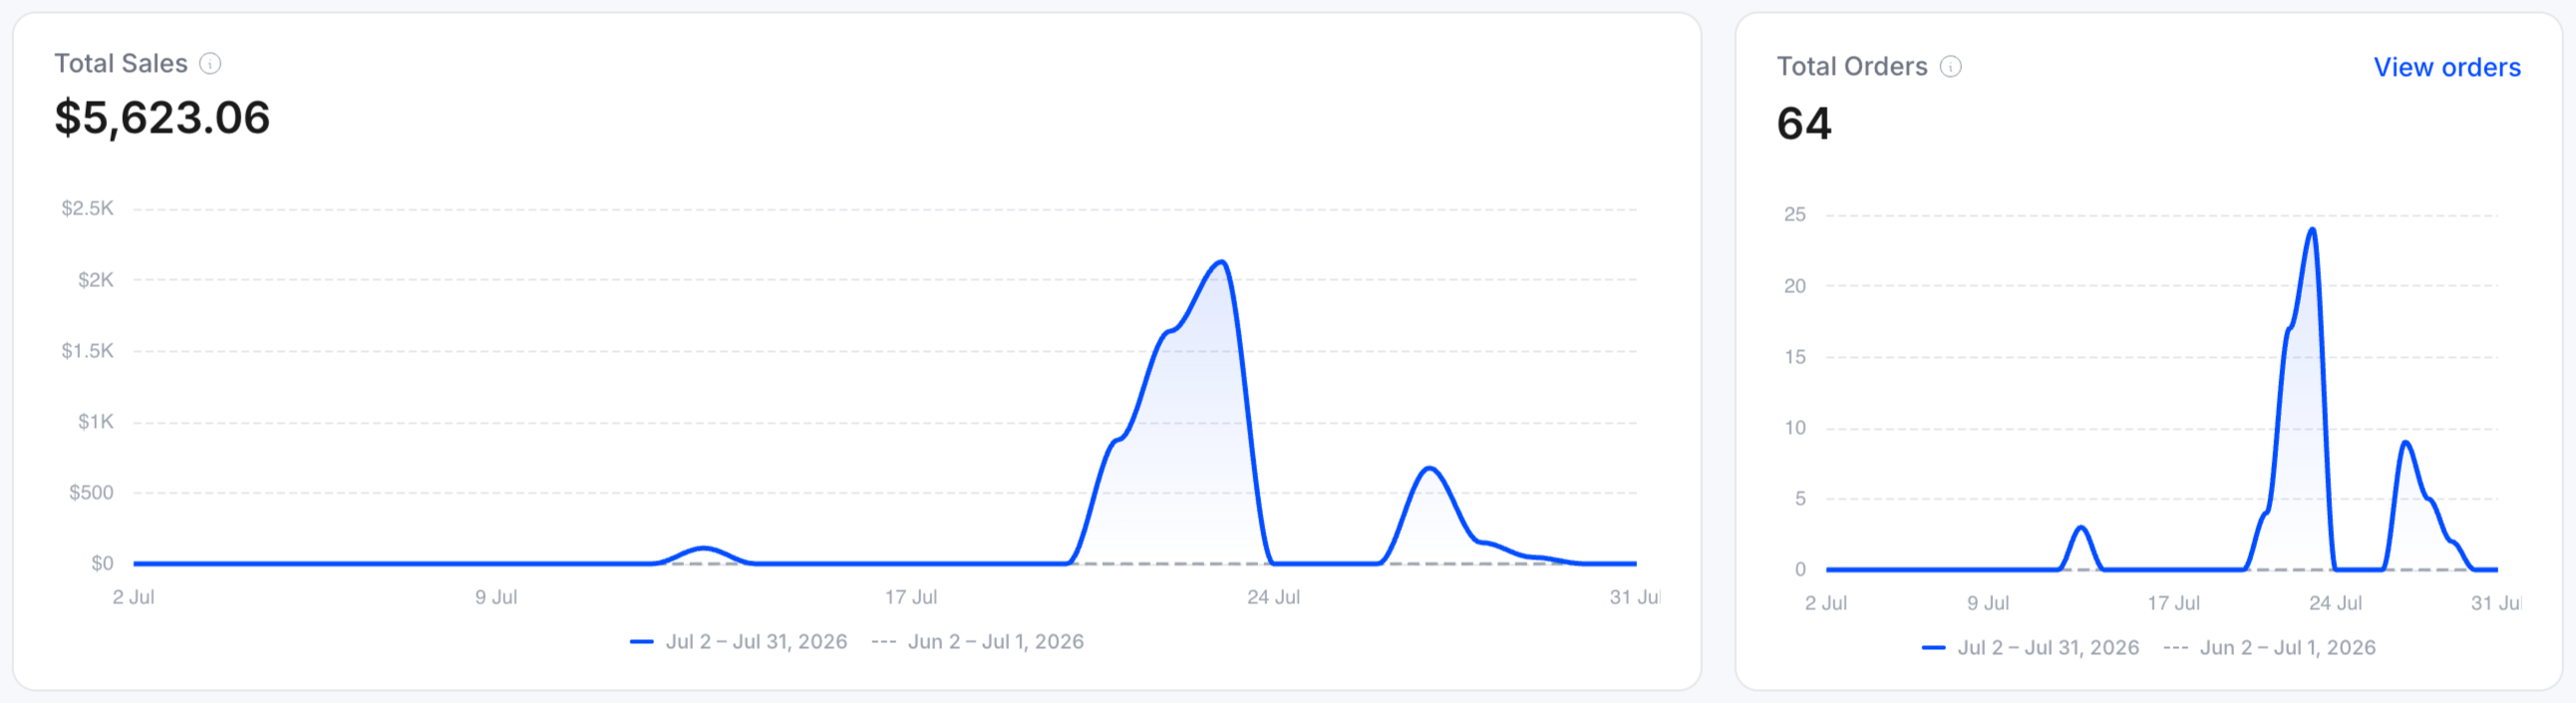
Total Sales is the single source of truth. Sales by category, top products, sales by location, and sales by payment method are four independent breakdowns of that same revenue. Add any one of them up and it should equal the headline exactly. If it does not, the problem is upstream in attribution, not in the chart.
Four numbers
that explain the total.
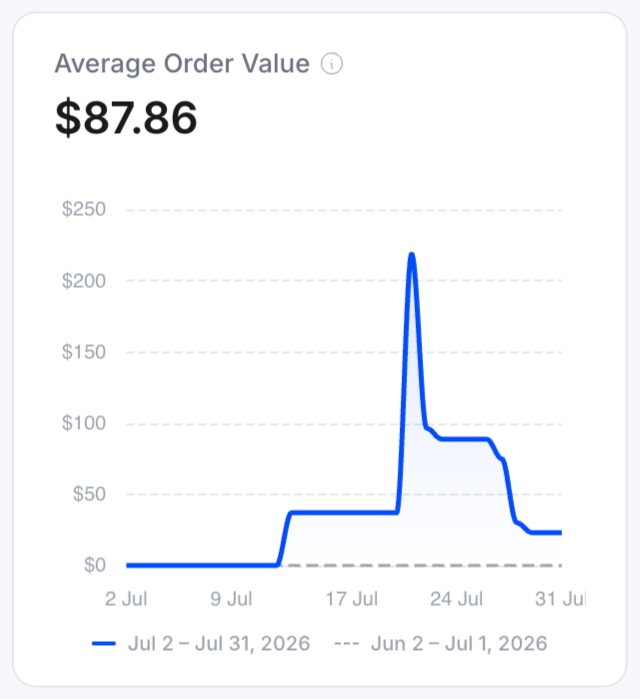
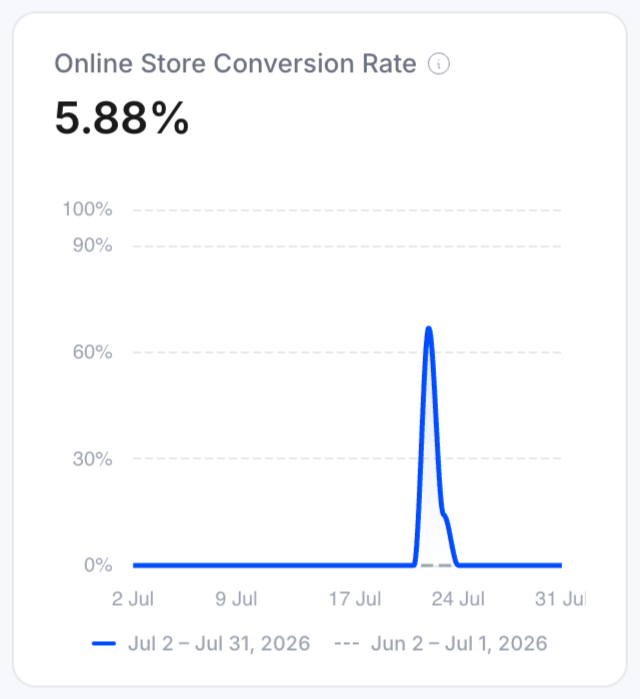
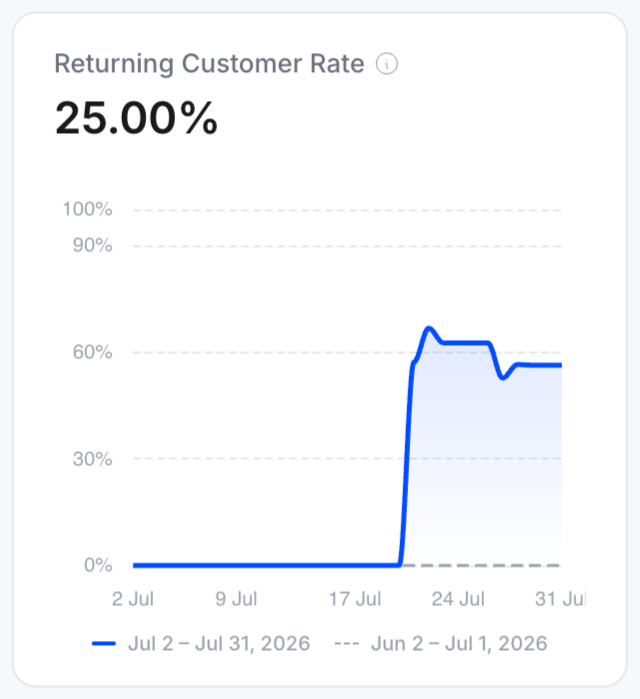
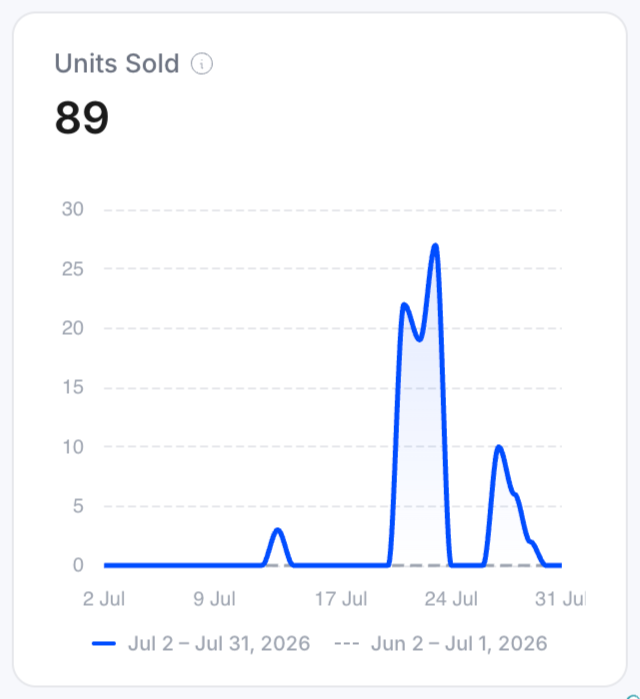
A quick sanity check you can run yourself: average order value multiplied by total orders should land on total sales.
Which products carry the store,
and which categories do.
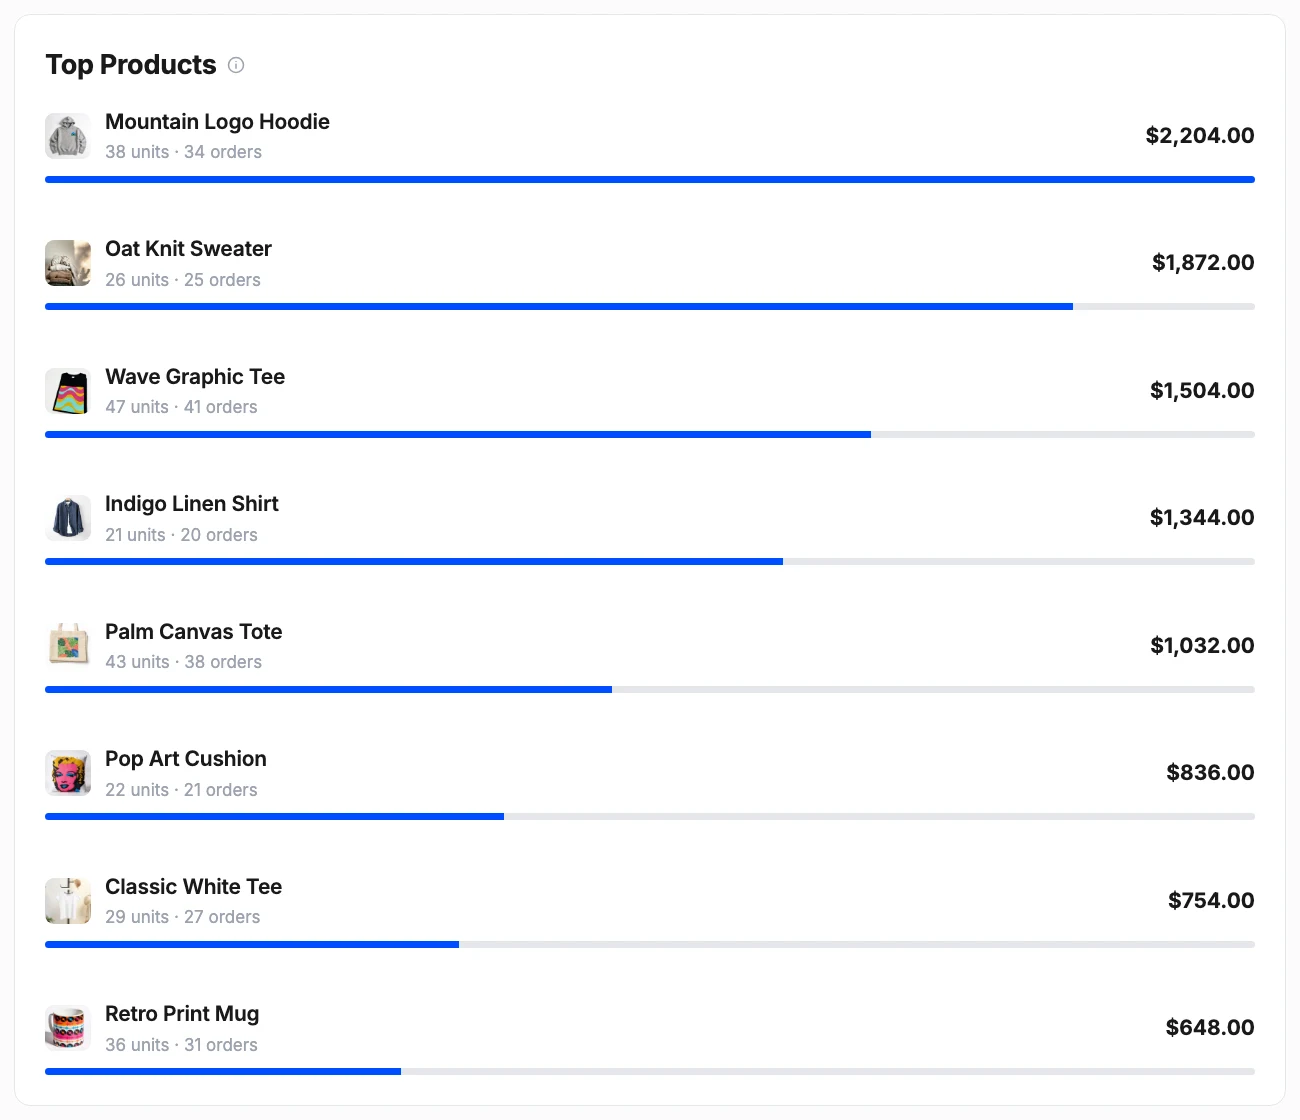
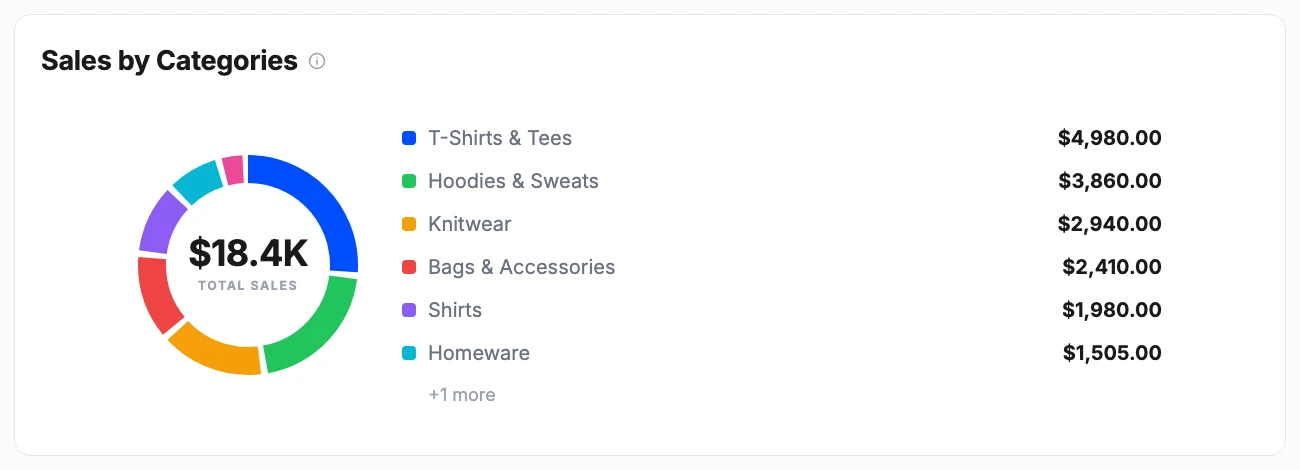
Read it as a shortlist
The product list answers what to restock and what to promote. The donut answers whether one category is quietly carrying everything, which is the risk you want to see early rather than late.
Who is coming back,
on what, and from where.
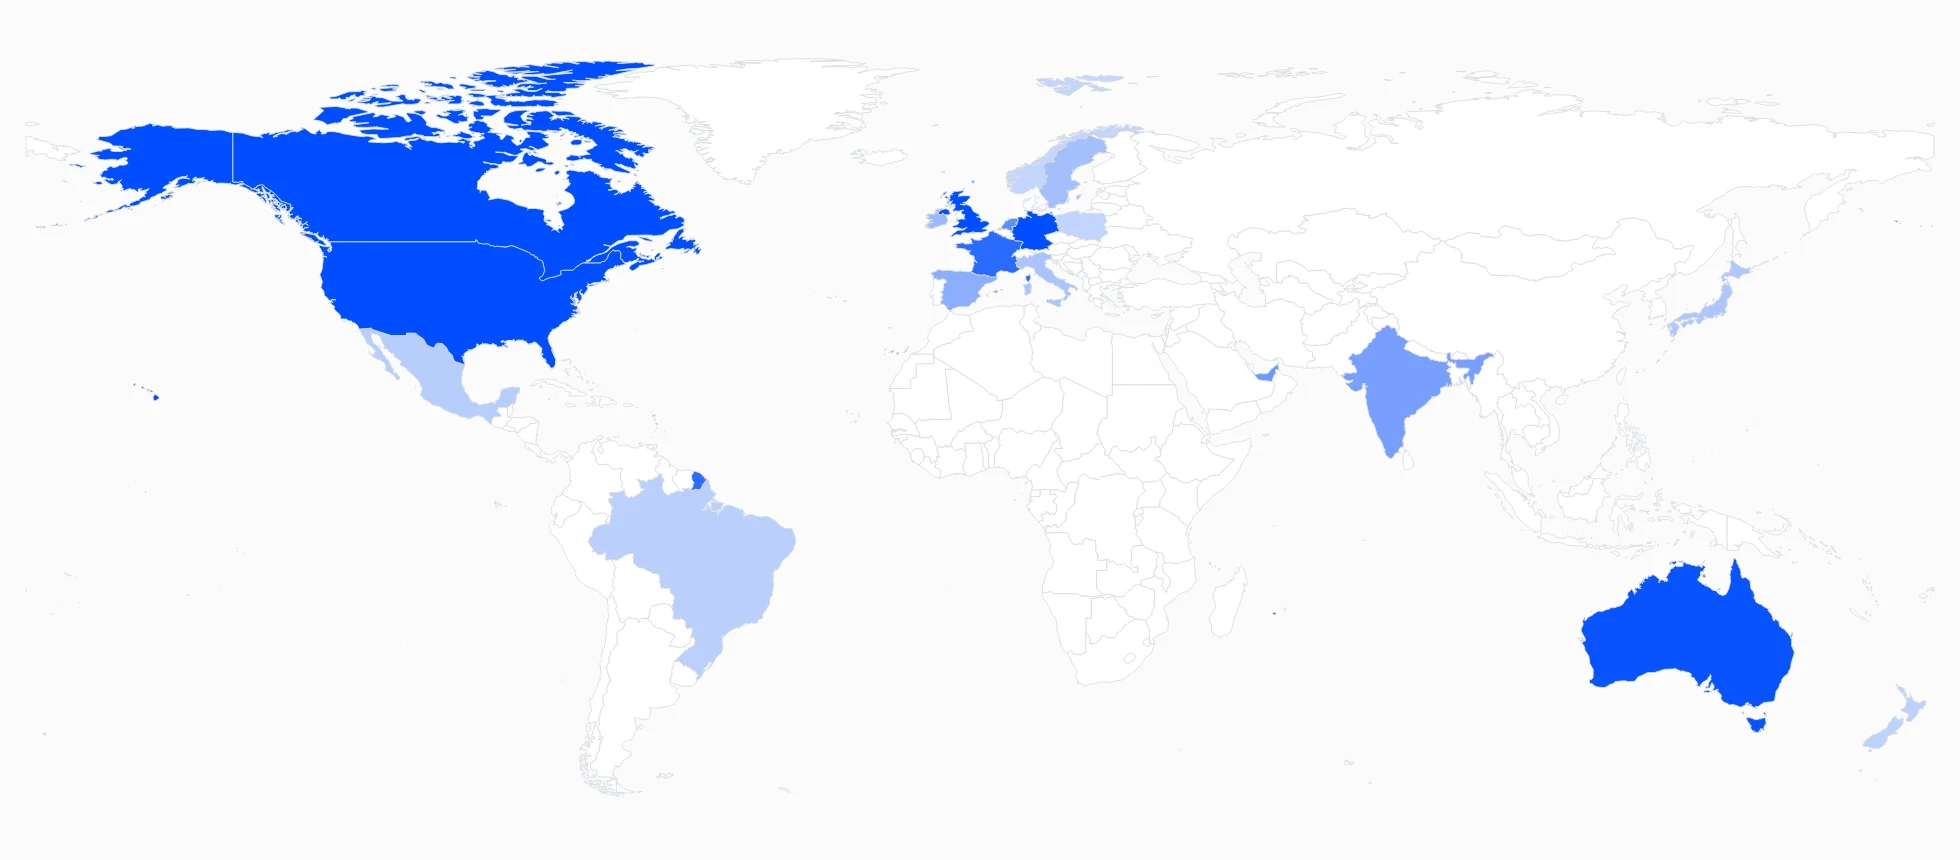
Sessions by location
Countries shaded by volume, your top country, state, and city called out, and a table underneath you can expand to drill from a country into its cities. Useful the day you decide where to ship from, or which market is worth a translated page.
No pixel. No tag manager.
No one else holding your numbers.
The store measures itself. That is why the reports work on a fresh install with nothing configured, and why the data stays yours.
Nothing to install
No tag manager, no container, no snippet to paste into a theme file and then forget about when the theme changes.
Not blocked by default
Because measurement is part of the store rather than a third-party script, the reports do not quietly lose a slice of visitors to blockers.
Yours to keep
The numbers live with your store data. There is no separate account that owns your history and no export to beg for.
The questions
the numbers raise.
Why does average session duration show 0:00?
Duration only accumulates once a visitor views more than one page. A session that lands on the homepage and leaves has no second timestamp to measure against, so it contributes nothing. It fills in as people browse deeper.
Why can a product show a view-to-order rate above 100%?
Views and orders are counted over the same window but do not have to come from the same sessions. A product bought by repeat customers, or added to a cart without visiting its page, can record more orders than product-page views.
Why do sessions by source and revenue by source disagree?
The donut only reflects sessions with a known source, while the revenue list includes channels that carried sessions but produced no orders. They are answering two different questions on purpose.
Do my own visits pollute the numbers?
No. Visits that start from your dashboard, such as clicking view store, are recorded as Direct rather than Referral, so checking your own storefront never inflates your referral traffic.
Why does Store Speed say it is still measuring?
Speed signals are sampled from roughly one in four real visits, so a quiet store needs a little traffic before the card fills in. It is a sampling limit rather than a fault.
Does any of this need a cookie banner vendor or a pixel?
No. Measurement is first-party and part of the store itself, so there is no third-party pixel to add, no tag manager to maintain, and no external account holding your history.
Your store already knows.
Go and look.
Sales and Traffic are on every plan, measured first-party, with nothing to install.